Reporting
Nevada Mercury Control Program (NMCP) - Annual Emissions Reporting
Pursuant to NMCP regulations, facilities must report mercury emissions and the mercury co-product collected annually. Annual reports are received by the NDEP in the month of March, each year. The NDEP reviews the data submittals and aggregates the data into a spreadsheet report by July 1st, each year. Mercury emissions are calculated for every thermal unit, which is not De Minimis, using the most recent NDEP-approved stack test emission factor with actual throughput (production) values for the year. The Annual Emissions Reporting (pdf) document describes the emissions reporting protocol and the NMCP Method 29 Source Test Guidelines (pdf) contains the Method 29 source test parameters. Learn more about Method 29 (pdf).
TRI Reporting is Different Than NMCP Reporting
Under the US EPA Toxic Release Inventory Program (TRI), the threshold for facilities to report mercury (mercury compounds) is 10 lbs per calendar year. TRI defines a mercury compound as “any unique chemical substance that contains mercury as part of the chemical’s infrastructure.” TRI reporting calculates emissions from releases to air (fugitive and point sources), water discharges, land, transfers off site and other waste management activities.
The NMCP requires annual mercury emissions reporting from thermal units only (point sources). The NMCP has explicit testing and data requirements that differ from TRI. The NMCP only allows the use of a US EPA Reference Test Method 29, approved by the NMCP, from the same calendar year as the reporting year. An NMCP-approved test consists of: an NMCP-approved protocol, an NMCP-witnessed test and an NMCP-approved test report. A facility may use an NMCP-approved source test for TRI reporting, but other data sources acceptable forTRI reporting are not acceptable for NMCP reporting. Therefore, TRI and NMCP data values may be different for the same unit.
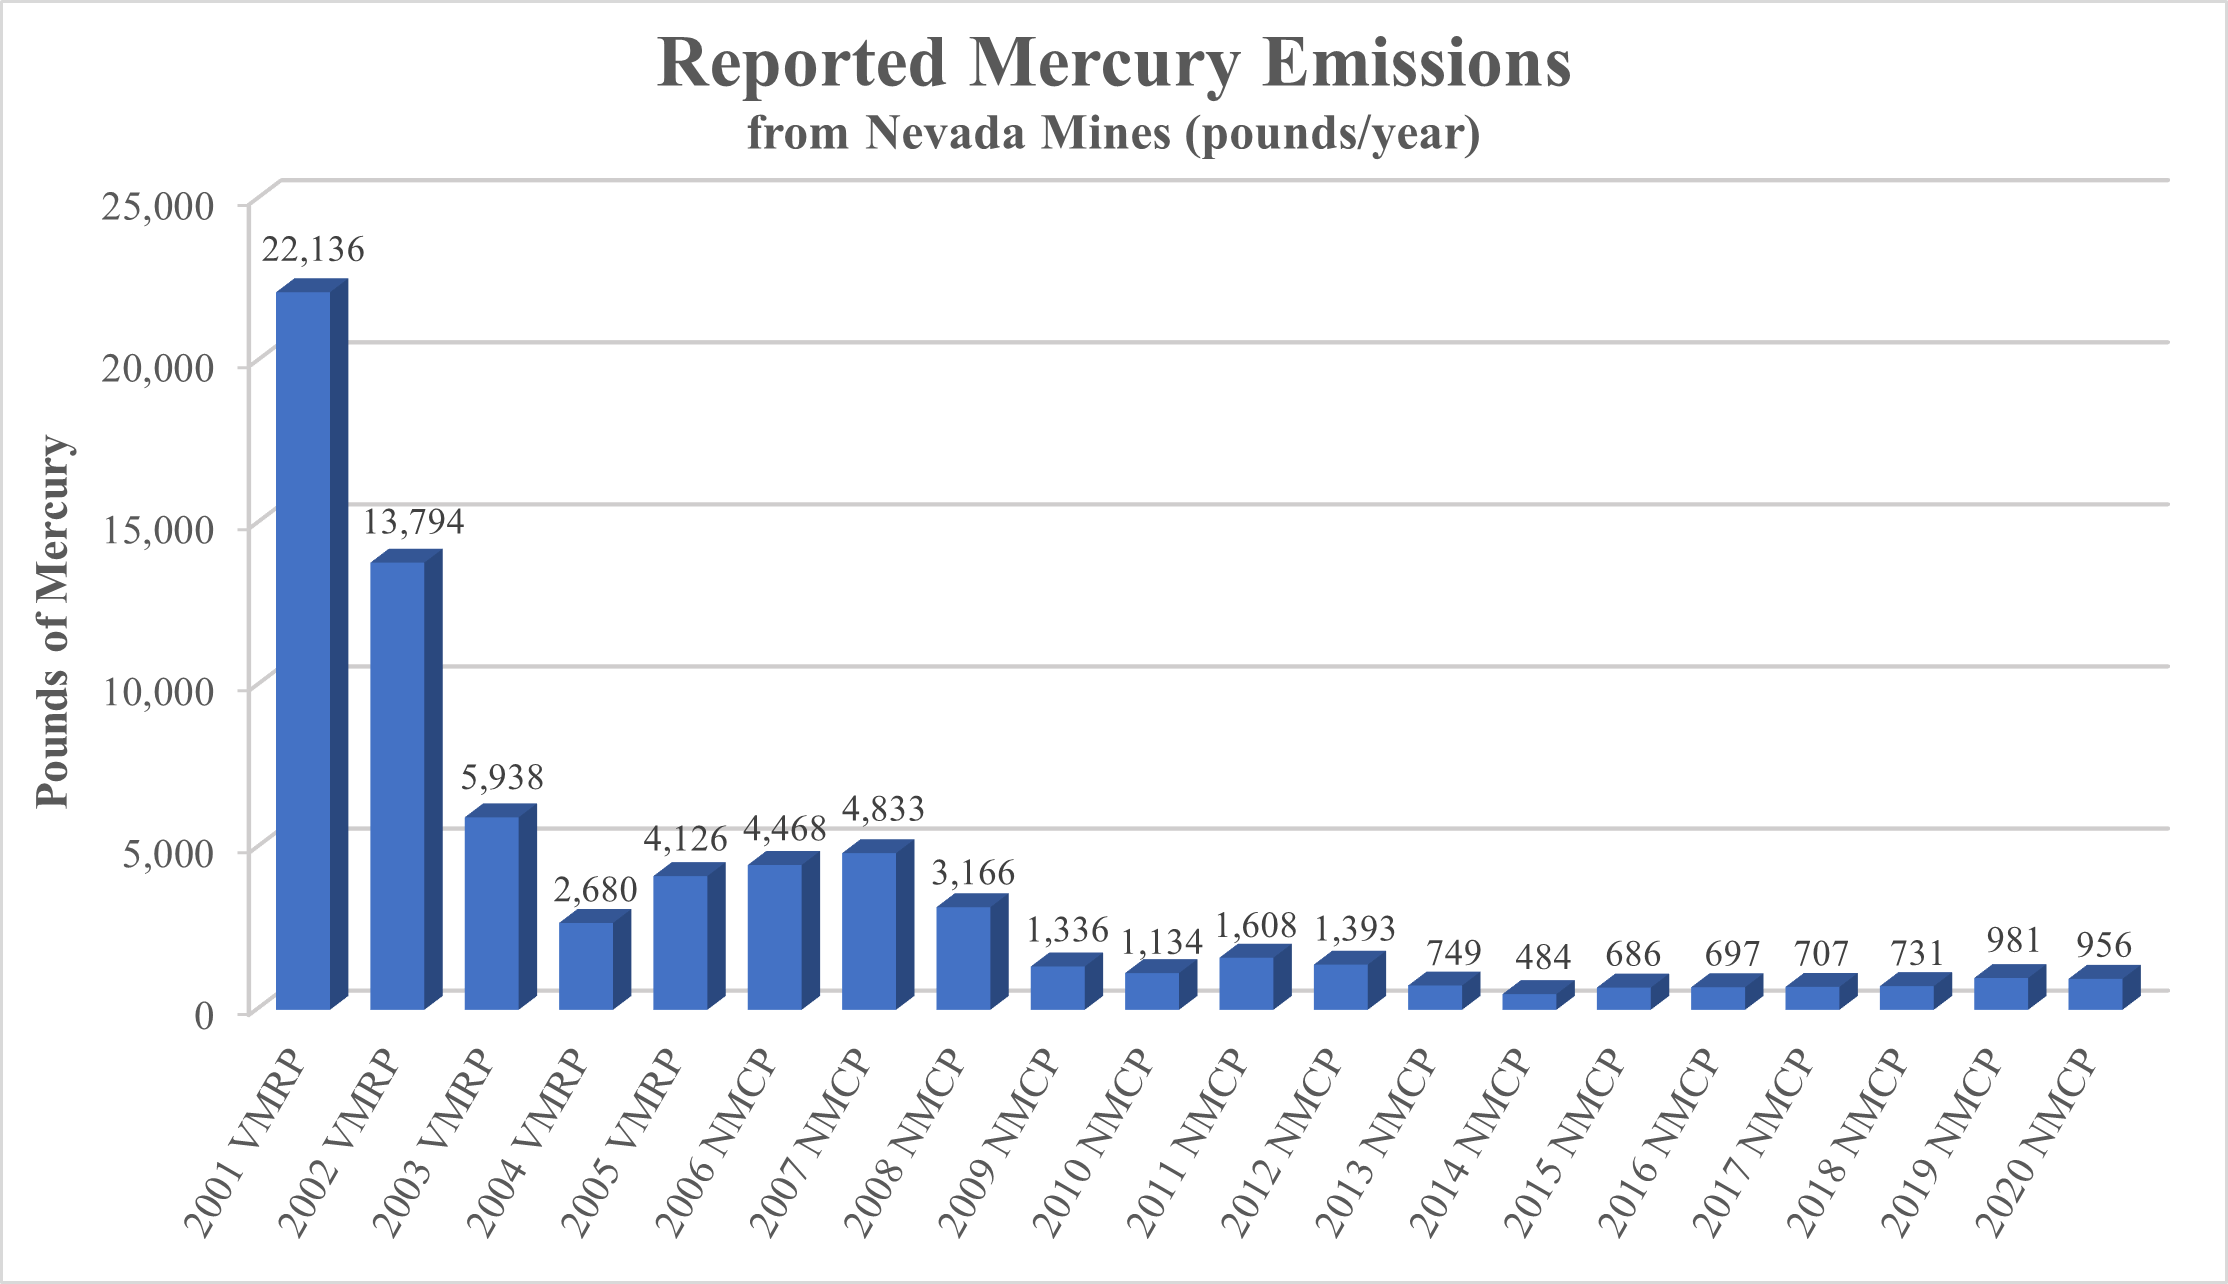
Total Reported Mercury Emissions by Year
This chart displays total mercury emissions using data from the Nevada Mercury Control Program (NMCP), and the Voluntary Mercury Reduction Program (VMRP).
Below is a table of total reported mercury emissions by facility and calender year (CY) for the past 10 years. For more detailed reports in PDF format, click on the calender year heading (that is, CY 2011). For detailed reports from prior reporting years, see below
| Nevada Mercury Control Program Anual Emissions Summary (lbs of Hg) | |||||||||
| Source | CY 2012 | CY 2013 | CY 2014 | CY 2015 | CY 2016 | CY 2017 | CY 2018 | CY 2019 | CY 2020 |
|---|---|---|---|---|---|---|---|---|---|
| Nevada Gold Mines - Twin Creeks Mine (#2218) (formerly Newmont - Twin Creeks Mine) | 695.20 | 148.52 | 68.41 | 20.36 | 19.97 | 21.25 | 65.93 | 58.52 | 30.30 |
| Newmont - Phoenix (#2247) | 0.37 | 0.54 | 0.58 | 0.58 | 0.62 | 0.67 | 0.62 | DNO(2) | DNO(2) |
| Newmont - Lone Tree (#2251) | 1.88 | 1.88 | 1.88 | 1.88 | 1.88 | 1.88 | 1.68 | 1.68 | 2.11 |
| Nevada Gold Mines - Carlin Mine (#2219) (formerly Newmont - Gold Quarry) | 231.85 | 96.63 | 115.91 | 190.35 | 132.11 | 193.95 | 245.17 | 310.96 | 174.41 |
| Klondex - Midas (#2253) | 21.83 | 16.36 | 2.62 | 3.07 | 6.57 | 16.11 | 2.57 | 2.49 | 2.32 |
| KG Mining - Bald Mountain (#2246) | 3.15 | 3.64 | 3.64 | 3.12 | 3.12 | 2.32 | 2.32 | 2.32 | 5.22 |
| Nevada Gold Mines - Carlin Complex (#2221) (formerly Barrick - Goldstrike) | 334.98 | 386.03 | 227.30 | 263.03 | 271.83 | 177.57 | 252.76 | 491.34 | 617.04 |
| Nevada Gold Mines - Turquoise Ridge (#2249) (formerly Barrick - Turquoise Ridge) | 4.95 | 4.95 | 4.74 | 4.66 | 4.66 | 6.26 | 0.33 | 0.33 | 0.34 |
| Barrick - Ruby Hill (#2252) | 1.38 | 1.38 | 1..38 | 1.38 | 1.38 | 1.38 | 1.38 | 1.38 | DNO(1) |
| Barrick - Cortez (#2220) | 4.22 | 15.76 | 2.22 | 6.18 | 6.01 | 3.81 | 3.33 | 19.92 | 17.52 |
| Jerritt Canyon (#2217) | 29.86 | 26.60 | 13.49 | 96.92 | 134.18 | 148.81 | 112.35 | 32.82 | 53.58 |
| Rawhide Mining Company (#2245) | 7.12 | 0.07 | 0.19 | 0.39 | 0.54 | 0.33 | 0.29 | 3.21 | 5.00 |
| Hycroft Resources (#2255) | 4.48 | 4.50 | 5.84 | 6.07 | 6.61 | 4.70 | 4.48 | 9.63 | 4.65 |
| Klondex Aurora Mine (#2248) | 3.71 | 0.03 | 0.01 | DNO(1) | 0.01 | 0.02 | 0.05 | 0.29 | 0.02 |
| Coeur Rochester (#2242) | 3.26 | 2.64 | 2.19 | 4.30 | 3.23 | 2.38 | 2.73 | 3.30 | 2.92 |
| Florida Canyon Mining (#2256) | 8.24 | 4.23 | 4.13 | 26.41 | 55.91 | 3.70 | 3.84 | 10.14 | 16.33 |
| Round Mountain Gold (#2250) | 4.20 | 4.71 | 9.06 | 5.47 | 6.88 | 5.85 | 8.71 | 19.64 | 3.54 |
| Marigold Mining Company (#2254) | 2.12 | 7.56 | 3.37 | 34.65 | 29.78 | 45.79 | 2.37 | 2.17 | 2.21 |
| Borealis Mining (#2228) | 12.05 | 0.04 | 0.03 | 3.94 | 0.02 | 0.00 | 0.01 | 1.13 | 0.02 |
| Mineral Ridge (#2222) | 2.13 | 2.99 | 2.99 | 2.99 | 2.99 | 2.99 | 2.99 | 2.99 | 2.99 |
| Comstock Mining, LLC (#2690) | 0.28 | 0.98 | 0.07 | 0.23 | 0.23 | 0.03 | 0.00 | 0.03 | 0.03 |
| Goldwedge Mine (#2803) (formerly Manhattan Mining) | 4.47 | 4.47 | 0.00 | 0.36 | 0.36 | 0.36 | 0.36 | 0.36 | 0.36 |
| Aurum Joint Venture, LLC (#2638) | 2.80 | 2.80 | 2.80 | 0.00 | 0.00 | DNO(1) | DNO(1) | DNO(2) | DNO(2) |
| United Mining Partners, LLC (#2701) | 4.00 | 4.00 | 4.00 | DNO(1) | 0.03 | 0.03 | DNO(1) | DNO(2) | DNO(2) |
| Tonkin Springs, LLC (#2726) | 4.92 | 4.92 | 4.92 | 4.92 | 4.92 | 4.92 | 4.92 | DNO(2) | DNO(2) |
| GRP Pan, LLC (#3302) (formerly Midway Gold US) | DNO(1) | DNO(1) | DNO(1) | 2.51 | 2.49 | 61.36 | 10.94 | 2.88 | 11.89 |
| Gold Acquisition Corp. (#3585) | DNO(1) | DNO(1) | DNO(1) | DNO(1) | 0.34 | 0.00 | 0.00 | 0.00 | 0.35 |
| Nevada Gold Mines 0 Long Canyon (#3833) (formerly Newmont Mining - Long Canyon) | DNO(1) | DNO(1) | DNO(1) | DNO(1) | DNO(1) | DNO(1) | DNO(1) | DNO(1) | DNO(1) |
| Walker Lane Minerals (#3895) | DNO(1) | DNO(1) | DNO(1) | DNO(1) | 0.00 | 0.62 | 0.62 | 0.62 | 0.63 |
| Osgood Mining (#3089) | DNO(1) | 2.42 | 2.42 | 2.42 | 0.00 | 0.00 | 0.00 | DNO(2) | DNO(2) |
| Mt. Hamiltion, LLC (#3520) | DNO(1) | DNO(1) | DNO(1) | 0.00 | 0.00 | 0.00 | 0.00 | 0.00 | 0.00 |
| WK-Allied Hasbrouck (#3669) (formerly WK Mining USA, LTD) | DNO(1) | DNO(1) | DNO(1) | DNO(1) | 0.00 | 0.00 | 0.00 | 0.00 | 0.00 |
| McEwan Mining, Inc. (#3801) | DNO(1) | DNO(1) | DNO(1) | DNO(1) | DNO(1) | 0.00 | 0.00 | 3.44 | 2.24 |
| Total | 1393.42 | 748.63 | 484.21 | 686.19 | 696.68 | 707.10 | 730.74 | 980.62 | 956.03 |
(1) Facility Did Not Operate (DNO) any thermal units in years indicated.
(2) Facility no longer subject to the Nevada Mercury Control Program